




Credit Risk
Credit risk management’s main objective is the identification, measurement, authorization, evaluation, monitoring, control and reporting of risks derived from financing and guarantee activities, as well as from national and foreign financial markets operations.
Strategy for Credit Risk Control
Its purpose is to reduce its concentration and improve the quality of the loan portfolio.
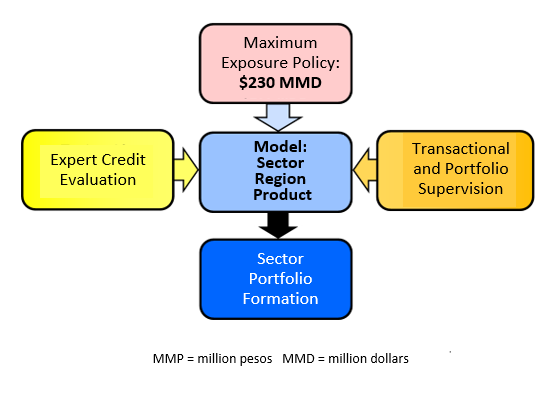
Bancomext adopted a Policy of Maximum Financing of USD $ 230 Million per economic group.
The Total Portfolio amounted to $ 261.8 billion pesos as of December 2018, with an overdue balance of $ 5.1 billion pesos, a default of 1.9% and a past-due portfolio coverage of 1.25 fold.
Evolution of the Private Sector Portfolio
The Business Portfolio experienced an average annual growth of 23.7% in 2012-2018.
The credit promotion policy led to an increase in the average balance per company, which has decreased in proportion to the portfolio balance.
Business Portfolio
Average Balance by Company

Credit Portfolio Participation. The BANCOMEXT Business Portfolio participation increased from 2014 to 2018 with respect to Multipurpose Banking. */
* / Excluding the consumer, housing and subsidiaries portfolio.
SOURCE: BANCOMEXT and the National Banking and Securities Commission (CNBV)
Size of the BANCOMEXT Credit Portfolio. In 2018, BANCOMEXT ranked 6th in bank financing for the Business Sector, having been ranked 8th in 2012.
Comparison with Multipurpose Banking. BANCOMEXT has guided credit-granting towards market segments that are complementary to Multipurpose Banking
CORPORATE PORTFOLIO INDICATORS 1/ | BANCOMEXT | MULTIPLE BANKING | |||
Annual Average 2010 - 2018 | Dec - 2018 | Annual Average 2010 - 2018 | Dec - 2018 | ||
| Corporate (% Total Portfolio) | 72.4% | 74.9% | 46.5% | 49.5% | |
Corporate Portfolio (%Growth) 2/ | 23.9% | 11.3% | 10.6% | 13.9% | |
| Past Due Portfolio (delinquency rate) | 1.1% | 2.5% | 2.2% | 1.6% | |
| Term (% Remaining payment): | ST(<= 1 Year) MT(1 a 3 Years) LT(> 3 Years) | 15.6% 25.6% 58.8% | 12.9% 26.7% 60.4% | 27.2% 24.7% 48.1% | 17.0% 18.1% 64.9% |
| Destination: | % Fixed Investment % Working Capital | 78.7% 21.3% | 76.8% 23.2% | 17.1% 82.9% | 18.6% 81.4% |
| Currency: | % Foreingn Currency % Mexican Currency | 64.2% 35.8% | 58.9% 41.1% | 25.1% 74.9% | 23.3% 76.7% |
| 1/Does not include guarantees, consumption and housing portfolios 2/ Growth in the current month compared to December of the previous year | Source: CNBV and BANCOMEXT | ||||

Business Portfolio Risk
The Past-Due Portfolio increased by 162% ($ 3.1 billion pesos) when compared to 2017.
Past-Due Portfolio Coverage decreased from 1.8 fold to 1.2 fold over this period.
Past-Due Portfolio
Past-Due Portfolio Coverage
The Expected Economic Loss increased from 1.8% in 2017 to 3.2% in 2018.
Credit Quality has been maintained, with an average balance structure of 90% in R1-R3 rated loans (better risk levels in internal rating).
Expected Loss
Portfolio Quality

Integration of the Strategic Sectors Portfolio
The Strategic Sectors Portfolio of 2018 was primarily integrated by Tourism, Industrial, and Energy Portfolios.
These three portfolios represent 44% of the Business Portfolio balance.
DEC – 2012
27.9 billion pesos
DEC – 2018
127.79 billion pesos

Risk Map of the Strategic Sector Portfolios
The most important Strategic Sectors in the 2018 balance were Tourism (15.7%), Industrial Infrastructure development (14.1%) and Energy (13.9%). The lower risk level portfolios were Industrial Infrastructure development (R1), Automotive (R2) and Mining and Metallurgical (R2).
DEC – 2012
DEC – 2018
Contingent Portfolio - Discount, International Trade Centre (ITC), Factoring and Guarantees
Guarantees. For the last four years, the Guarantee Portfolio has grown at an average rate of 20%, driven primarily by the Automatic Guarantee with losses below those of design.
Business | Counterparts | Balance (MMP) | Rating | Expected Losdd | Observed Loss |
Discount | Banks (14) | 21,286 | R1 | 0.2% | 0.0% |
| IFNB's (22) | 12,118 | R2 | 0.5% | 1.0% | |
| Total (36) | 33,283 | R1 | 0.3% | 0.4% | |
Letters of Credit | Banks (31) | 12,466 | R1 | 0.2% | 0.0% |
| Campanies (14) | 3,745 | R3 | 1.2% | 0.0% | |
| Total (45) | 16,211 | R1 | 0.4% | 0.0% | |
Guarantess */ | Automatic | 11,286 | Not applicable | 3.7% | 1.5% |
| Selective Agile | 462 | 5.4% | 0.0% | ||
| Corporate Factoring | 835 | 3.6% | 0.0% | ||
| FCI | 475 | 16.7% | 0.0% | ||
| Gtee Frgn Trade | 71 | 33.3% | 0.0% | ||
| Total | 13,129 | 4.3% | 1.4% | ||
International Factoring | Cofactors | 228 | R1 | 0.3% | 0.0% |
| Beneficiaries | Not applicable | 0.0% | 0.0% | ||
*/ The expected loss is covered with the counter-guarentee found. | |||||
Balance Risk
Banking Portfolio
Re-pricing: medium and long term leveled bands, after coverage. Downward sensitivity in interest rates.
Swaps position for hedging purposes, to cover the revaluation profile of the Banking Portfolio, with a near 100% efficiency.
Derivatives are traded with foreign bank counterparties top-rated by risk rating agencies (AAA to A) and national agencies (A1 and A2).